Running Build: problem setup
Running Vertex: phase diagram section computation
Running Pssect: phase diagram section depiction
Running Werami: extraction of seismic velocities
Figures:
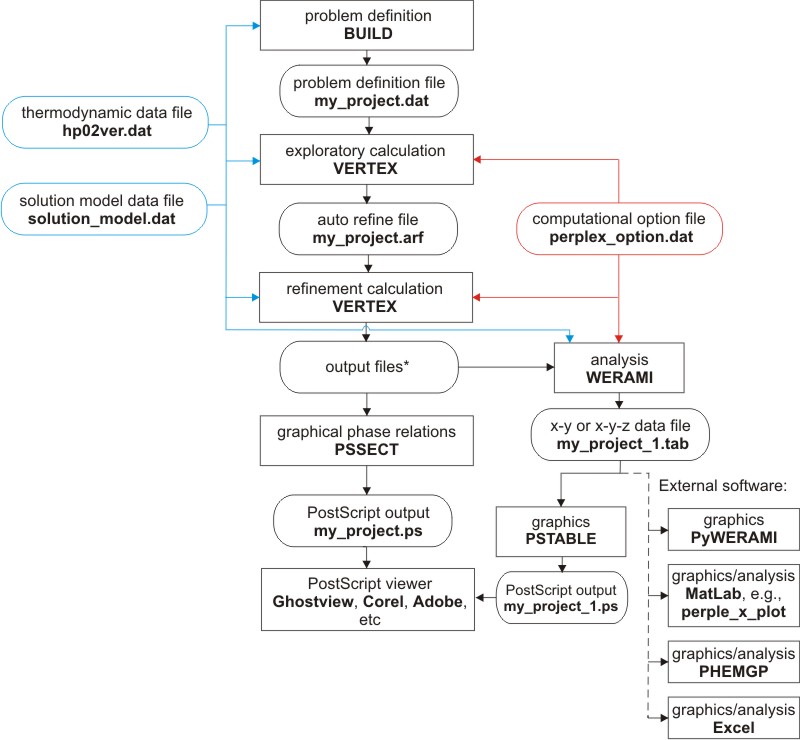
Figure 1: Perple_X program structure
This document details an application in which seismic velocities are recovered from a phase equilibrium model for a metabasalt as a function of pressure and temperature, i.e., an isochemical phase diagram section. The procedure to recover seismic velocities from a phase diagram section is no different than that to recover any other thermodynamic property with Perple_X; thus this document provides a generic template for the construction of phase diagram sections and recovery of thermodynamic properties. Readers who are not interested in the specifics of seismic wave-speed calculations should skip to the worked example section.
Recognition of the thermodynamic constraints on seismic wave-speeds has led some geophysicists to use free energy minimization to compute mineral modes and compositions as a function of bulk-rock composition, temperature, and pressure. These modes and compositions are then used to estimate seismic wave-speeds from semi-empirical models. This approach may be justified by the uncertainties involved, but it is thermodynamically inconsistent in that it amounts to using one thermodynamic database to establish the amounts of the minerals and a different thermodynamic database to compute the wave-speeds. For geophysicists who remain nonetheless enamored with empirical estimates of elastic modulii, Perple_X can be used to make calculations in this manner. However, I personally advocate using the same thermodynamic data for the computation of both the stable mineralogy and seismic velocities. The approach actually used in Perple_X is determined by the structure of the data base and options specified by the user as discussed below.
Perple_X programs read run-time options from a file with the default name perplex_option.dat, options of particular relevance to seismic velocity calculations are (see perplex_options for more details):
Anderson-Gruneisen - implements a theoretical estimator for the temperature dependence of the bulk modulus.
seimsic_data_file - write summary of wavespeed computational opions to my_project_seismic_data.txt.
bounds - specifies whether Hashin-Shtrikman or Voigt-Reuss bounds on elastic moduli are implemented.
vrh/hs_weighting - specifies the weighting used to average elastic moduli from the bounding values.
explicit_bulk_modulus - permits the bulk modulus to be specified independently of the isostatic equation of state.
poisson_ratio - permits the shear modulus to be expressed as a function of the bulk modulus.
melt_is_fluid - permits silicate melts to be excluded from calculations of solid aggregate properties.
Typically, thermodynamic data bases for phase equilibrium calculations are designed for the computation of isostatic phase equilibria (i.e., for systems without differential stresses), however seismic wave propagation involves shear stresses. Therefore to compute seismic velocities with Perple_X conventional thermodynamic data bases must be expanded to define a shear modulus that characterizes the thermodynamic response to shear stress. Any Perple_X thermodynamic data file can be modified to include empirical functions for the adiabatic shear and bulk moduli (see thermodynamic_data_files). However, even if a data file includes empirical functions for the bulk modulus, the isostatic equation of state will be used to compute the bulk modulus unless the explicit_bulk_modulus option is set to T (true).
Data files that have been prepared for seismic velocity calculations assume either an isostatic or a non-isostatic equation of state. See commonly used thermodynamic files for a relatively up-to-date summary and the bibliography of the files included in Perple_X.
As customary in seismic velocity computations, it is assumed that all phases are isotropic and therefore completely characterized by two independent elastic moduli. The density of any phase is computed as
ρ = N/diff(G,P),
where G is the molar Gibbs energy and N is the molar formula weight. For isostatic formulations, if the run-time option explicit_bulk_modulus = T, the adiabatic bulk modulus of any phase is computed as described in perplex_thermodynamic_data_files. Otherwise the adiabatic bulk modulus is computed as
KS = -diff(G,P)[diff(G,P,P)+diff(G,P,T)2/diff(G,T,T)].
The adiabatic shear moduli (μS) of individual phases are computed as described in perplex_thermodynamic_data_files, depending on whether the equation of state is isostatic or non-isostatic.
Seismic compressional and shear wave velocities through rock are determined by: the corresponding velocities within the constituent minerals; the amounts of the minerals; and rock texture. For a rock in thermodynamic equilibrium, the first two factors are determined entirely by thermodynamic properties and are computed automatically by Perple_X. The third factor, texture, determines the relation of the bulk rock seismic velocities to those of the constituent minerals. As texture is not a thermodynamic property, the averaging schemes used to compute bulk rock velocities are equivocal. Two popular averaging schemes, Hashin-Shtrikman (HS) and Voigt-Reuss-Hill (VRH) are supported in Perple_X (bounds, vrh/hs_weighting). Once the aggregate moduli have been computed, the compressional and shear wave-speeds are
vp = [(KS + 4μS/3)/ρ]1/2, vs = [μS/ρ]1/2
No provision is made within Perple_X to account for irreversible effects (dissipation).
The example provided here (originally from Connolly & Kerrick 2002) illustrates the computation of seismic velocities through an altered metabasalt at P-T conditions relevant to subduction zones at depths of 90-240 km. The type of calculation in this example generates an isochemical phase diagram section. Such sections are commonly, albeit incorrectly, referred to as pseudosections (Appendix of Connolly & Petrini 2002).
The calculation and interpretation of a phase diagram section consists of five steps (Figure 1): the problem definition; the phase diagram section computation and depiction; computational assessment; digital interpretation; and graphical interpretation. Each step involves different programs that are described in the following sections:
Phase diagram section computation, VERTEX
Phase diagram section depiction, PSSECT
Figure 1. Perple_X program structure for gridded minimization calculations (i.e., for phase diagram section and phase fractionation calculations). The file names given as examples are not prescribed. VERTEX, PSSECT and WERAMI request the name of the problem definition file generated by BUILD (e.g., my_project). PSTABLE and Perple_X MATLAB scripts request a file named by adding an integer suffix to this name (e.g., my_project_1), where the integer indicates the number of calculations made with WERAMI. All files generated by VERTEX are named by combining the root name of the problem definition file with different file type suffixes. For typical calculations, the files required by subsequent programs, in addition to the solution, thermodynamic and option files, are: my_project.dat (problem definition file), my_project.plt (plot file), my_project.blk (assemblage file), my_project.arf (auto-refine data file), and my_project.tof (auto-refine flag file).
The following dialog details the prompts from the program BUILD (normal font) and user responses (bold font). Explanatory comments are written in red. Additional explanation on some prompts is available via the (help) links.
c\jamie\perp666> build
Perple_X version 6.8.6, source updated Jan 18, 2019.
Copyright
(C) 1986-2019 James A D Connolly <www.perplex.ethz.ch/copyright.html>.
NO
is the default (blank) answer to all Y/N prompts (help)
Enter a
name for this project (the name will be used as the root for all output file
names) [default = my_project] (help)
in17a
Project names should not include blanks or "." characters, but they may include directory information. The project name can be up to 100 characters long, but because Perple_X output files are named using project name plus various suffixes (e.g., .dat, .plt, .prt, .arf, .tof, .tab) it is unwise to specify names that are longer than 92 characters.
The problem definition file will be named: in17a.dat
Enter thermodynamic data file name, left justified, [default = hp02ver.dat]: (help)
hp02ver.dat
The file hp02ver.dat is a version of the Holland and Powell (1998, revised 2002) data base modified (Connolly 2005) to include shear modulii relevant to the high pressure mineralogy of metabasalts. The hp02ver.dat file is suitable for calculations to pressures approaching 12 GPa. Sources and brief descriptions of commonly used files are at thermodynamic_data_files.
Enter the computational option file name, left justified, [default = perplex_option.dat]:
(see: www.perplex.ethz.ch/perplex_options.html)
perplex_option.dat
Reading computational options from: perplex_option.dat
Run-time computational options via the computational option file. This file is normally named perplex_option.dat. Provision is made here to specify an alternative name because it sometimes desirable to have customized option files for specific purposes (e.g., high resolution or solvus calculations).
The current data base components are:
NA2O MGO AL2O3 SIO2 K2O CAO TIO2 MNO FEO O2 H2O CO2
Transform them (Y/N)? (help)
n
Component transformation permit the replacement of an existing component with a linear combination of components, e.g., FE2O3 = 2 FEO + ½ O2 can replace O2 or FeO. In general, it is easier to do the component transformation in the data base itself using the CTRANSF program than it is to use this possibility in BUILD.
Specify computational mode:
1 - Convex-Hull minimization
2 - Constrained minimization on a 2d grid [default]
3 - Constrained minimization on a 1d grid
4 - Output pseudocompound data
5 - 1-d Phase fractionation
6 - 0-d Infiltration-reactionation-fractionation
7 - 2-d Phase fractionation (FRAC2D and TITRATE reactive transport models)
Use Convex-Hull minimization for Schreinemakers projections or phase diagrams with > 2 independent variables. Use constrained minimization for phase diagrams or phase diagram sections with < 3 independent variables.
2
The problem in this tutorial is the construction of a two-dimensional phase diagram section, this is most easily accomplished using gridded minimization.
The next block of prompts determines the manner in which the chemical components specified in the thermodynamic data file are to be used. VERTEX permits components to be treated in four different ways: saturated phase components are components whose chemical potentials are determined by the (assumed) stability of a phase, most commonly a fluid, containing these components; saturated components are components whose chemical potentials are determined by the (assumed) stability of a pure phase(s) and or solutions containing only the saturated-phase and saturated components; mobile components are components whose chemical potentials are defined explicitly; and thermodynamic components are components whose chemical potentials are the dependent variables of a phase equilibrium calculation. Phase diagram calculations require the specification of at least one thermodynamic component.
Calculations with a saturated FLUID (Y/N)? (help)
n
Here the system is not assumed to be saturated with respect to a fluid phase, rather fluid stability and composition is a function of the physical conditions. The closed system model requires that the fluid components are specified as thermodynamic components (below). There are problems with such a model, but the closed system model for water-CO2 bearing systems is certainly less arbitrary (and probably more realistic) than the petrological artifice of assuming that the system is saturated with respect to a fluid with a fixed composition. More realistic models for devolatilization require path-dependent models, such models are implemented in Perple_X as 1-d phase fractionation or 2-d phase fractionation (reactive transport) models. The main problem with the closed system model is that it implies that fluid generated by devolatilization remains within the system. This problem can be overcome by instructing WERAMI to compute the seismic properties of the solid aggregate (a limiting case).
Calculations with saturated components (Y/N)? (help)
n
Use chemical potentials, activities or fugacities as independent variables (Y/N)? (help)
n
Select thermodynamic components from the set: (help)
NA2O MGO AL2O3 SIO2 K2O CAO TIO2 MNO FEO O2 H2O CO2
Enter names, left justified, 1 per line, [cr] to finish: SIO2
TIO2
AL2O3
FEO
MGO
CAO
NA2O
K2O
H2O
CO2
Because
the thermodynamic data file identifies H2O and CO2 as special
components, the following prompt specifies the EoS to be used for the
corresponding composants and mixtures thereof. To override this behavior, e.g.,
to use a generic hybrid fluid
EoS, delete the special_component section from the
thermodynamic data file header.
Select fluid equation of state:
0 - X(CO2) H2O-CO2 Modified Redlich-Kwong (MRK) DeSantis et al 74
1 - X(CO2) H2O-CO2 HSMRK Kerrick & Jacobs 81
2 - X(CO2) H2O-CO2 MRK hybrid-EoS*
5 - X(CO2) H2O-CO2 CORK Holland & Powell 91, 98
8 - f(O2/CO2) C-buffered COH MRK hybrid-EoS*
10 - X(O) C-buffered COH MRK hybrid-EoS Connolly & Cesare 93*
12 - X(O)-f(S2) C-buffered COHS MRK hybrid-EoS Connolly & Cesare 93*
13 - X(H2) H2O-H2 MRK hybrid-EoS*
14 - X(CO2) H2O-CO2 Pitzer & Sterner 94; Holland & Powell mixing 03
15 - X(H2) H2O-H2 low T MRK hybrid-EoS*
16 - X(O) H-O MRK hybrid-EoS*
17 - X(O)-f(S2) H-O-S MRK hybrid-EoS*
19 - X(O)-X(S) C-buffered COHS MRK hybrid-EoS Connolly & Cesare 93*
20 - X(O)-X(C) COHS MRK hybrid-EoS Connolly & Cesare 93*
24 - f(O2/CO2)-N/C C-buffered COHN MRK hybrid-EoS*
25 - X(CO2)-X(NaCl) H2O-CO2-NaCl Aranovich et al 10
26 - X(O) O-Si MRK Connolly 16
27 - X(O)-X(C) C-O-H MRK hybrid-EoS*
*Hybrid EoS use the following pure species EoS, to change these associations
modify the hybrid_EoS keywords in the perplex_option file:
H2O - PSEoS Pitzer & Sterner 1994
CO2 - PSEoS Pitzer & Sterner 1994
CH4 - MRK DeSantis et al 1974
5
Geological thermodynamic data bases are fit using a particular fluid equation of state (EoS), in such cases it is preferable to use that EoS.
The next block of prompts defines the explicit computational variables. Here we are concerned with a normal P-T section; however, in gridded minimization it is possible to construct sections as a function of any arbitrarily defined composition (variable X(C1) below) or along a geothermal gradient, for examples of such calculations refer to the T-X, P-X and X-X section and phase abundances along an arbitary path tutorials.
The data base has P(bars) and T(K) as default independent potentials. Make one dependent on the other, e.g., as along a geothermal gradient (y/n)? (help)
n
Select x-axis variable: (help)
1 - P(bars)
2 - T(K)
3 - Composition X(C1)* (user defined)
*X(C1) cannot be selected as the y-axis variable
2
Enter minimum and maximum values, respectively, for: T(K)
673 1473
Enter minimum and maximum values, respectively, for: P(bars)
30000 80000
The following blurb provides information on the resolution with which phase relations are mapped as a function of the section variables. This resolution is controlled via the grid_parameters keywords specified in the perplex_option.dat file. When the option auto_refine = auto (the default) calculations involve two iterations: an initial low resolution exploratory stage establishes the range of stable phase compositions; and a second high resolution auto-refine stage computes the final results.
For gridded minimization, grid resolution is determined by the number of levels (grid_levels) and the resolution at the lowest level in the X- and Y-directions (x_nodes and y_nodes) these parameters are currently set for the exploratory and autorefine cycles as follows:
stage grid_levels xnodes ynodes effective resolution
exploratory 1 20 20 20 x 20 nodes
auto-refine 4 60 60 473 x 473 nodes
To change these options edit or create the file perplex_option.dat
see: www.perplex.ethz.ch/perplex_options.html
Specify component amounts by mass (Y/N)?
y
Molar units are the alternative to mass (weight) units.
The amounts entered next need not be normalized; regardless of units, they define molar amount of the system.
Enter mass amounts of the components: (help)
SIO2 TIO2 AL2O3 FEO MGO CAO NA2O K2O H2O CO2
for the bulk composition of interest:
45 1.1 15.26 9.84 6.54 12.66 2.03 0.55 2.63 2.9
Output a print file (Y/N)? (help)
n
The print file is usually not useful for gridded minimization calculations unless a list of the phases considered is desired.
The final block of prompts from BUILD define the phases for the calculation.
Exclude endmember phases (Y/N)? (help)
y
For inexperienced users it is best to begin by including endmember phases (i.e., stoichiometric or pure phases and stoichiometric chemical potential buffers). This allows the user to identify flaws in her perception of what the stable phases should be and/or problems in the thermodynamic data.
The endmember phases are identified by abbreviated names, in general these abbreviations are defined in the header section of the thermodynamic data file, in a few cases separate lists of endmember abbreviations are available (perplex_thermodynamic_data_files). If in doubt open the thermodynamic data file in a text editor and/or read the source.
Here, experience leads to four exclusions: Clinozoisite (cz) is excluded to suppress the zoisite-clinozoisitetransition, which is primarily a distraction in terms of interpreting phase equilibria. The water endmember of the Holland & Powell melt model (h2oL) is excluded because the endmember is (incorrectly) more stable than water at high pressure and low temperature (this difficulty can also be circumvented by specifying the T_melt keyword in perplex_option.dat). The "aluminum-free chlorite" endmember (afchl) of the Holland et al. (1988) chlorite model is excluded because the use of this endmember requires many more pseudocompounds to resolve chlorite compositions yet it has almost no effect on the computed phase relations. tiGL is the liquid TiO2 endmember for the PMELTs model, its stability field seems to excessive relative to Holland & Powell's data for Ti-bearing solids.
Do you want to be prompted for phases (Y/N)?
n
Enter names, left justified, 1 per line, press <enter> to finish:
czafchl
h2oL
tiGL
Include solution phases (Y/N)? (help)
y
Enter the solution model file name [default = solution_model.dat]: (help)
solution_model.dat
...diagnostics omitted...
BUILD reads the solution model file and determines which solutions are consistent with the specified problem. The diagnostics (omitted here) can usually be ignored. They are useful if you discover that a solution you wish to include is not present in the list of solutions BUILD offers.
Select phases from the following list, enter 1 per line, press <enter> to finish: (help)
electrolytic_fluid models Aq_yuri Aq_solven0clinopyroxene models: Cpx(H) Augite(G) Cpx(JH) Cpx(l) Cpx(h)
Cpx(stx) Cpx(stx7) Omph(HP) Cpx(HP) Cpx(m)
Cpx(stx8) Omph(GHP)
clinoamphibole models: cAmph(G) Cumm Gl Tr Act(M)
cAmph(DP) cAmph(G)_I GlTrTsMr Ca-Amph(D) Na-Amph(D)
GlTrTsPg Amph(DHP) Amph(DPW)
liquid models: melt(H) melt(G) melt(W) melt(HP) pMELTS(G)
mMELTS(G) LIQ(NK) LIQ(EF)
chlorite models: Chl(W) Chl(HP) Chl(LWV)
olivine models: O(JH) O(SG) O(HP) O(HPK) O(stx)
O(stx7) Ol(m) O(stx8)
spinel models: Sp(JH) GaHcSp Sp(JR) Sp(GS) Sp(HP)
Sp(stx) CrSp Sp(stx7) Sp(WPC) Sp(stx8)
binary-feldspar models: Pl(JH) Pl(h) Kf San San(TH)
Pl(stx8)
garnet models: Grt(JH) Gt(W) CrGt Gt(MPF) Gt(B)
Gt(GCT) Gt(HP) Gt(EWHP) Gt(WPH) Gt(stx)
Gt(stx8) Gt(WPPH) ZrGt(KP) Maj
orthopyroxene models: Opx(JH) Opx(W) Opx(HP) CrOpx(HP) Opx(stx)
Opx(stx8)
white-mica models: Mica(W) Pheng(HP) MaPa Mica(CF) Mica(CHA1)
Mica(CHA) Mica+(CHA) Mica(M) Mica(SGH)
chloritoid models: Ctd(W) Ctd(HP) Ctd(SGH)
staurolite models: St(W) St(HP)
biotite models: Bi(W) Bio(TCC) Bio(WPH) Bio(HP)
cordierite models: Crd(W) hCrd
sapphirine models: Sa(WP) Sapp(TP) Sapp(HP) Sapp(KWP)
osumilite models: Osm(HP)
fluid models: F F(salt) COH-Fluid COH-Fluid+ WADDAH
scapolite models: Scap
carpholite models: Carp Carp(M) Carp(SGH)
sudoite models: Sud(Livi) Sud Sud(M)
orthoamphibole models: Anth oAmph(DP) o-Amph
ternary-feldspar models: feldspar feldspar_B Pl(I1,HP) Fsp(C1)
carbonate models: Do(HP) M(HP) Do(AE) Cc(AE) oCcM(HP)
Carb(M) oCcM(EF) dis(EF)
ilmenite models: IlHm(A) IlGkPy Ilm(WPH)
feldspathoid models: Neph(FB)
alphabet-phase models: A-phase
clinohumite models: Chum
brucite models: B
pumpellyite models: Pu(M)
stilpnomelane models: Stlp(M)
wuestite models: Wus
High pressure garnet mode Gt(H)
ferropericlase models: Fper(H)
talc models: T
serpentine models: Atg(PN)
For details on these models see: www.perplex.ethz.ch/perplex_solution_model_glossary.html or read the commentary in the solution model file.
The solution model glossary is usually out-of-date; however, the second suggestion is useful especially for recent models. For serious calculations, read the model source, this often provides insight into which combination of models is considered optimal and with which thermodynamic data base. While some effort is made to keep the solution model files up-to-date, many of the models are revised frequently and errors are not uncommon. Therefore, it is wise to check the model parameters against the source and/or to benchmark test by reproducing calculated phase equilibria in the source.
F
Chl(HP)
Mica(CF)
San
Pl(h)
Gt(HP)
Do(HP)
M(HP)
Opx(HP)
Omph(GHP)
Bio(TCC)
T
Because fluid is not specified as a saturated phase it is necessary to specify explicitly that a fluid solution may be present (i.e., the solution model F).
Enter calculation title:
Staudigel closed system model
BUILD creates a problem definition file (in17a.dat), named by adding the suffix ".dat" to the project name, that summarizes the users input. To avoid the tedious procedure of running BUILD for minor modifications, the problem definition file can be edited in a text-editor to modify physicochemical conditions, solution model choices or other parameters.
If the auto_refine option is on calculations are done in two stages: an initial low quality exploratory stage establishes the range of phase compositions; and a final high resolution auto-refine stage. These stages are executed in a single calculation, as done here, only if the value of the auto_refine keyword is auto. Before running VERTEX verify that the auto_refine keyword is set to auto (or default) in your copy of perplex_option.dat. For a brief summary of what VERTEX is actually [not] doing refer to Perple_X_why_it_often_does_not_work.html.
NOTE: warnings in the summary written at the end of the auto-refine stage are potentially important. To permit viewing of this summary, other warning/error messages, VERTEX should be run from a console/window that does not close once the program terminates and the screen buffer size should be set to a value large enough that is possible to scroll backwards to the exploratory stage summary (see hints for Mac , Windows, Linux, and Unix users). If this is not possible, examine the *_auto_refine.txt file (e.g., in17a_auto_refine.txt) after the exploratory stage has completed (the *_auto_refine.txt file is generated if the auto_refine_file keyword is set to T or default).
c\jamie\perp666> vertex
Perple_X version 6.8.6, source updated Jan 19, 2019.
Copyright (C) 1986-2019 James A D Connolly <www.perplex.ethz.ch/copyright.html>.
Enter the project name (the name assigned in BUILD) [default = my_project]:
in17a
VERTEX begins by asking for a project name, i.e., the name specified by the first BUILD prompt.
Reading problem definition from file: in17a.dat
Reading thermodynamic data from file: hp02ver.dat
Reading solution models from file: solution_model.dat
Writing print output to file: not requested
Writing plot output to file: in17a.plt
Writing bulk composition plot output to file: in17a.blk
Reading computational options from: perplex_option.datWriting pseudocompound glossary to file: not requested
Writing auto refine summary to file: in17a_auto_refine.txt
Writing computational option summary to file: not requested
Once the project name has been entered VERTEX lists the input/output files to be used/created for the calculation. Several potential output files are optional user information file, these include: the print file (requested in the problem definition file), a pseudocompound glossary that summarizes the static discretization points used for a calculation (requested with the pseudocompound_file keyword in perplex_option.dat), the auto refine summary, which lists the ranges of the stable solution phases (requested with the auto_refine_file keyword in perplex_option.dat), the computational option summary, which lists the options in perplex_option.dat that are relevant to the calculation (requested with the option_list_files keyword in perplex_option.dat).
The file summary is followed by an echo of the computational options for the particular calculation as specified in perplex_option.dat:
Gridded minimization calculations involve two independent discretization schemes. The first which is specified by the 2D grid options, highlighted in blue below, controls the density at which the phase relations within the pressure-temperature (or whatever independent variables have been chosen) coordinate frame is sampled (Connolly 2005), while the second, highlighted in green, control the precision of the adaptive minimization procedure (Connolly 2009). To improve the resolution of phase boundaries it is important that the resolution of both discretization schemes be increased in a commensurate manner, i.e., it makes no sense to create a dense sampling grid if the precision of the individual minimizations is low. The parameters that control the precision are discussed elsewhere, the most important parameters are initial_resolution and final_resolution.
Perple_X computational option settings for VERTEX:
All "make definitions" consistent with the problem definition file are output next. Make definitions define thermodynamic entities (e.g., buffers, endmembers or reactions) as a linear combination of independent entries in the thermodynamic data file. The make definitions are in the header section of the thermodynamic data file and can be modified, deleted or created for your own purposes, see thermodynamic data files for more information.
Summary of make-definition entities:
tbi fbr fchum fphA fper fatg
atgts sil8L fo8L fa8L q8L ts_dqf
parg_dqf gl_dqf mpa ged_dqf ogl_dqf fanth_dq
cumm_dqf grun_dqf coma tbit ma_dqf dilm
The remaining section of the initial console output consists of information and warnings on the solution models to be used in the calculation. These messages inform the user as to which solution models in the solution model file are compatible with the problem definition, i.e., that the solution end-members are possible phases for the calculation. If only a subset of the solution model end-members are present, the messages indicate how the model will be reformulated in terms of this subset. If you do not get the solution models you requested, or if you get different solution compositions than you expect, these messages may be helpful. The diagnostics also indicate the number of static pseudocompounds used for each solution, this number is useful for determining which solution models are costly in terms of computer memory.
**warning ver099** no data for aqueous species, aq_output and aq_lagged_speciation disabled.
**warning ver114** the following endmembers are missing for Opx(HP)
mots feots
**warning ver050** reformulating prismatic solution: Opx(HP) because of missing endmembers. (reformulation can be controlled explicitly by excluding additional endmembers).
286 pseudocompounds generated for: Opx(HP)
**warning ver114** the following endmembers are missing for Bio(TCC)
ffbit fbit mnbi
**warning ver050** reformulating prismatic solution: Bio(TCC) because of missing endmembers. (reformulation can be controlled explicitly by excluding additional endmembers).
1986 pseudocompounds generated for: Bio(TCC)
15 pseudocompounds generated for: F
15 pseudocompounds generated for: Pl(h)
15 pseudocompounds generated for: San
15 pseudocompounds generated for: Do(HP)
**warning ver114** the following endmembers are missing for M(HP)
rhc
15 pseudocompounds generated for: M(HP)
**warning ver114** the following endmembers are missing for Gt(HP)
spss
150 pseudocompounds generated for: Gt(HP)
**warning ver114** the following endmembers are missing for Omph(GHP)
acm_dqf
150 pseudocompounds generated for: Omph(GHP)
150 pseudocompounds generated for: T
**warning ver114** the following endmembers are missing for Chl(HP)
mame_i mafchl_i mnchl fafchl_i afchl
**warning ver050** reformulating prismatic solution: Chl(HP) because of missing endmembers. (reformulation can be controlled explicitly by excluding additional endmembers).
**warning ver059** endmember fame_i in solution model Chl(HP) has invalid site populations.
150 pseudocompounds generated for: Chl(HP)
site_check_override is on for Chl(HP)
Total number of pseudocompounds: 2947
** Starting exploratory computational stage **
The preceding line terminates the initial section of the console output. Often this section is followed by warning messages such as:
**warning ver369** failed to converge at T= 673.00 K, P= 72105.3 bar Using Murnaghan EoS, probably for Ghiorso et al. MELTS/PMELTS endmember data. Volume estimated using 3rd order Taylor series.
that indicate unstable numerical behavior of specialized equations of state, most commonly these result because the calibration is being used beyond the range of physical conditions for which it was intended. In general, these warnings have no significant consequences, but if you have doubts it is possible to eliminate the offending entity (e.g., here endmembers of the pMELTS(G) silicate melt model cause problems at subsolidus temperatures and pressures far beyond the 4 GPa upper limit for the pMELTS calibration).
During the computation VERTEX outputs progress information:
5.0% done with low level grid.
10.0% done with low level grid.
15.0% done with low level grid.
...output abridged...
90.0% done with low level grid.
95.0% done with low level grid.
100.0% done with low level grid.
Beginning grid refinement stage.
After completion of the exploratory stage, VERTEX indicates which solution phases were not stable and the compositional ranges of the stable solution phases, this information, which is saved in in17a.arf and echoed in more readable form in in17a_auto_refine.txt. Although it does not occur in this example, a warning such as:
**warning ver991** The compositions of the following solutions reached internal limits that were automatically relaxed:
Mica(CF)
If the restrictions are unintentional, then relax the corresponding limits in the solution model file and restart the calculation.
merits attention. Scan the text following the warning for the compositional information on Mica(CF), e.g.:
Endmember fractions for model: Mica(CF)
Endmember Minimum Maximum
cel 0.25868 0.77604
fcel 0.91146E-01 0.31076
mu 0.00000 0.89410
Then open the solution_model.dat file in a text editor and compare this data to ranges specified specified for the Mica(CF) model:
0. .1 0.1 0 | cel subdivision range, imod = 0 -> cartesian subdivision
0. .1 0.1 0 | fcel subdivision range, imod = 0 -> cartesian subdivision
0. .5 0.1 0 | mu subdivision range, imod = 0 -> cartesian subdivision
The comparison reveals that the range for the mu endmember has been relaxed. Although the relaxation may eliminate subsequent problems, it is generally wise to widen the range specified in the solution model and to repeat the calculation (e.g., expand the range for the mu endmember from 0. .5 to, say, 0. .6. See the discussion in the commentary at the beginning of the solution_model.dat file for more information on subdivision ranges and their consequences. Warnings about the relaxation of solution model limits after the auto-refine stage can usually be ignored. For more examples and discussion refer to warning_ver991, error_ver041, and/or Step 3 of the Niigata tutorial.
The following solutions were input, but are not stable:
Opx(HP)
Bio(TCC)
Pl(h)
Chl(HP)
Endmember fractions for model: F
Endmember Minimum MaximumCO2 0.0000 0.33113
Endmember fractions for model: San
Endmember Minimum Maximumsan 0.79167 0.95312
Endmember fractions for model: Mica(CF)
Endmember Minimum Maximum
cel 0.27083 0.78125
fcel 0.93750E-01 0.31250
mu 0.0000 0.06771
Endmember fractions for model: Do(HP)
Endmember Minimum Maximum
dol 0.73438 0.85938
Endmember fractions for model: M(HP)
Endmember Minimum Maximum
mag 0.01042 0.86458
Endmember fractions for model: Gt(HP)
Endmember Minimum Maximum
alm 0.33854 0.69792
py 0.41934E-01 0.27170
Endmember fractions for model: Omph(GHP)
Endmember Minimum Maximum
di 0.40658 0.81771
jd 0.83333E-01 02124
Endmember fractions for model: T
Endmember Minimum Maximum
ta 0.90104 0.94792
fta 02083E-01 0.88542E-01
The failure rate during speciation (order-disorder) calculations is 0.000% out of a total of 3710700. calculations.
Average number of iterations per speciation calculation: 4.0
At this point if the auto_refine keyword were set to manual or off, VERTEX would terminate, allowing the user to examine intermediate results, but requiring that VERTEX be run a second time to obtain the final high resolution calculation. However this example has been run with auto_refine set to auto (or default), thus VERTEX automatically begins the auto-refine stage of the calculation:
At the beginning of auto-refine stage VERTEX eliminates all solution phases specified in the problem definition file (in17a.dat) that were not stable in the exploratory calculation and then restricts the compositional ranges for the remaining solutions to those found in the exploratory calculation (plus an increment to allow for inaccuracy), additionally the compositional resolution of the calculation within these restricted ranges is increased.Reading auto-refinement data from file: in17a.arf
Eliminating solution model: Chl(HP) in auto-refinement.
Eliminating solution model: Pl(h) in auto-refinement.
Eliminating solution model: Opx(HP) in auto-refinement.
Eliminating solution model: Bio(TCC) in auto-refinement.
17 pseudocompounds generated for: F
10 pseudocompounds generated for: San
a reach_increment of 3 is specified for San
4378 pseudocompounds generated for: Mica(CF)
8 pseudocompounds generated for: Do(HP)
19 pseudocompounds generated for: M(HP)
247 pseudocompounds generated for: Gt(HP)
336 pseudocompounds generated for: Omph(GHP)
9 pseudocompounds generated for: T
Total number of pseudocompounds: 5024
** Starting auto_refine computational stage **
0.3% done with low level grid.
2.9% done with low level grid.
...output abridged...
98.3% done with low level grid.
100.0% done with low level grid.
In contrast to the exploratory stage, the grid_parameter keyword specifies a multi-level (i.e., 4-level) grid for the auto-refine stage, thus after the calculation of the first (or "low level") grid, VERTEX makes three refinements of the grid, each of these refinements takes roughly twice the time of the previous refinement.
Beginning grid refinement stage.
401 grid cells to be refined at grid level 2
...working ( 501 minimizations done)
refinement at level 2 involved 868 minimizations
2468 minimizations required of the theoretical limit of 6241
773 grid cells to be refined at grid level 3
...working ( 134 minimizations done)
...working ( 635 minimizations done)
...working ( 1136 minimizations done)
refinement at level 3 involved 1559 minimizations
4027 minimizations required of the theoretical limit of 24649
1572 grid cells to be refined at grid level 4
...working ( 79 minimizations done)
...working ( 581 minimizations done)
...working ( 1083 minimizations done)
...working ( 1584 minimizations done)
...working ( 2087 minimizations done)
...working ( 2589 minimizations done)
refinement at level 4 involved 3025 minimizations
7052 minimizations required of the theoretical limit of 98596
Warning ver991 issued at the end of the auto-refine stage generally can be safely ignored provided the warnings were not also issued at the end of the exploratory stage. The exploratory stage warnings are preserved in *_auto_refine.txt file. It is recommended that this file be examined and the warnings eliminated before a result is considered to be acceptable (see above).
**warning ver991** The compositions of the following solutions reached internal
limits that were automatically relaxed:
...output abridged...
VERTEX terminates as in the exploratory cycle with a summary of the phase compositions, as previously at the end of the exploratory stage of the calculation.
With the exception of data bases generated by Stixrude, Lithgow-Bertelloni, & colleagues, elastic moduli are computed from empirical functions that have been added to the original isostatic EoS parameterized in the thermodynamic data file. This addition may be haphazard or entirely absent in some files and, given the various options for treating missing data, it may be difficult for users to identify problematic data. To reduce this source of confusion Perple_X (6.8.8+) writes a summary of wavespeed relevant computational options (provided the seimsic_data_file option keyword is T or default) to a text file, named by combining the project name with the suffix _seismic_data.txt.
For individual endmembers and solutions the designation: implicit indicates the modulus is computed from the EoS provided with the original data; explicit indicates the modulus is computed from an empirical function; missing indicates the data and/or options are such that the no modulus will be calculated; Poisson indicates the shear modulus is computed from the bulk modulus with an assumed Poisson ratio; and fluid indicates the phase has no shear modulus. An abridged example of this file is reproduced below:
Seismic wavespeed computational options:
bounds VRH [VRH] HS
vrh/hs_weighting 0.5 [0.5] 0->1
explicit_bulk_modulus T [T] F
poisson_ratio on [on] all off; Poisson ratio = 0.35
seismic_output som [some] none all
poisson_test F [F] T
Anderson-Gruneisen F [F] T
Tisza_test F [F] T
In the tables below: implicit moduli are calculated rigorously from the EoS,
explicit moduli are computed from empirical functions provided in the
thermodynamic data file.
Endmembers and stoichiometric compounds:
Bulk Mod Shear Mod
--------- ---------
fo explicit explicit
fa explicit explicit
lrn explicit explicit
... output abridged ...
wu implicit Poisson
... output abridged ...
perL implicit fluid
limL implicit fluid
... output abridged ...
acm_dqf explicit explicit made entity*
... output abridged ...
mots implicit explicit made entity*
... output abridged ...
hmL implicit fluid made entity*
ekL implicit fluid made entity*
*explicit moduli of made endmembers are computed as a linear combination of
the real endmembers specified in the corresponding make definition.
Solutions:
Bulk Mod Shear Mod
--------- ---------
Cpx(JH) explicit explicit
O(JH) explicit explicit
Sp(JH) explicit explicit
Pl(JH) explicit explicit
Grt(JH) explicit explicit
Opx(JH) explicit explicit
PSSECT generates PostScript graphical output and can be used once the phase diagram section has been calculated with VERTEX. The default plot from PSSECT shows the computed phase relations (Figure 2) and is generated by the following dialog.
C:\jamie\Perple_X>pssect
Perple_X version 6.8.6, source updated Jan 19, 2019.
Copyright (C) 1986-2019 James A D Connolly <www.perplex.ethz.ch/copyright.html>.
Enter the project name (the name assigned in BUILD) [default = my_project]:
in17a
Perple_X
plotting programs (PSSECT, PSTABLE, PSVDRAW, PSPTS) read options that control the graphical output (image size, orientation, etc) from a file named perplex_plot_option.dat, these options are summarized after the project name is read. PSSECT also reads the computational option file perplex_option.dat.Reading computational options from: perplex_option.dat
Perple_X plot options are currently set as:
Keyword: Value: Permitted values [default]:
axis_label_scale 1.20 [1.2] (rel)
bounding_box :
0 [0] x-min (pts)
0 [0] y-min (pts)
800 [800] x-length (pts)
800 [800] y-length (pts)
field_fill T [T] F
field_label T [T] F
field_label_scale 0.75 [0.72] (rel)
font Helvetica
grid F [F] T
half_ticks T [T] F
line_width 1.00 0-99 [1.] (pts)
picture_transformation :
0.180 [0.18] x-scale (rel)
0.180 [0.18] y-scale (rel)
130. [0.18] x-translation (pts)
220. [0.18] y-translation (pts)
0.00 [0.0] rotation (deg)
plot_aspect_ratio 1.000 [1.0] x_axis_length/y_axis_length
replicate_label 0.250 0->1 [0.025]
splines T [T] F
tenth_ticks F [F] T
text_scale 1.000 [1.] (rel)
To change these options edit or create the plot option file
See: www.perplex.ethz.ch/perplex_plot_options.html
The graphical output file (in17a.ps) from PSSECT is (in fact) encapsulated PostScript.
PostScript will be written to file: in17a.ps
Answer yes to the following prompt to: specify rational numerical labels for the axes, restrict the range of the independent variables, or to show equilibria involving specific phases or phase assemblages.
Modify the default plot (y/n)?
n
The following diagnostic is issued because, if a phase assemblage is stable in more than one field of a section, then the fields may not be labeled. Whether multiple fields for the same assemblage are individually labeled is controlled by the replicate_label keyword in perplex_plot_options.dat.
There are 2 fields for: Omph(GHP) F Mica(CF) Do(HP) Gt(HP) coe ru arag kcym
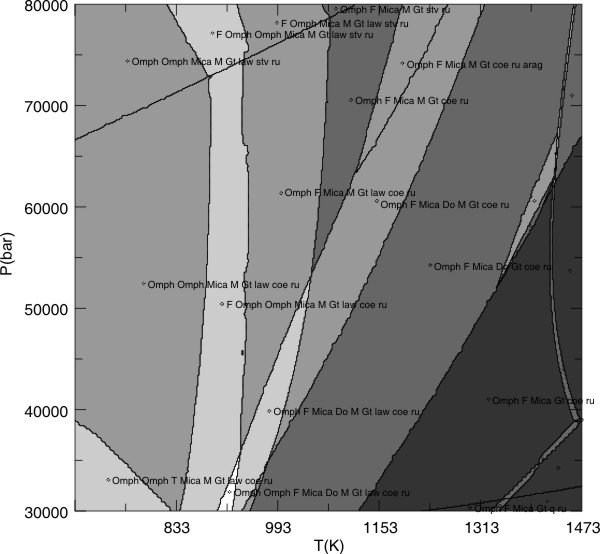
Once PSSECT finishes, the output file (plot17a.ps) can be viewed with any graphics program (e.g., Adobe Illustrator, CorelDraw, Ghostview) or printer capable of interpreting encapsulated PostScript (Figure 2).
Figure 2. Computed metabasalt phase relations (in17a.ps), this figure differs from Figure 2a of Connolly & Kerrick (2002) because the published figure was calculated
with different solution models. To simplify the plot the solution model
abbreviations have been shortened (e.g., Omph(GHP) has been changed to Omph) and
some field labels have been eliminated.
Top
WERAMI permits the user to extract information from a phase diagram section at a point (operational mode 1), throughout a region (mode 2), or along a line or curve (modes 3 and 4). The latter two options generate output that can be plotted with PSTAB, PyWerami or general-purpose programs such as Matlab. The dialog and output for each of these modes is detailed in the pseudosection tutorial. Here the second mode is used to extract P-wave velocities for the metabasalt over the entire range of pressure-temperature conditions represented by the phase diagram section.
c\jamie\perp666> werami
Perple_X version 6.6.5.9, compiled 5/14/2011.
Enter the project name (the name assigned in BUILD) [default = my_project]:
in17a
Although the phase equilibria analyzed by WERAMI are computed by VERTEX, seismic wave-speeds are only computed in WERAMI. Consequently, the computational options that influence wave-speeds can be changed without necessitating that the calculation be repeated with VERTEX. For example, a weakness of the thermodynamic formulation (Holland & Powell 1998) used for the present calculation is that it sometimes results in non-physical expansivities. This weakness is of no major consequence for phase equilibria computations, but can be problematic for the calculation of seismic or physical properties at elevated pressure. A simple remedy (Helffrich & Connolly 2009) for this problem is to change the value of the Anderson-Gruneisen keyword in perplex_option.dat from F to T after running VERTEX
Reading computational options from: perplex_option.dat
Writing computational option summary to file: not requested
Perple_X computational option settings for WERAMI:
Keyword: Value: Permitted values [default]:
Input/Output options:
spreadsheet T [F] T
logarithmic_p F [F] T
bad_number NaN [0.0]
compositions mol wt [mol]
proportions vol wt [vol] mol
interpolation on off [on ]
extrapolation off on [off]
melt_is_fluid F [F] T
Information file output options:
option_list_files F [F] T; echo computational options
Thermodynamic options:
approx_alpha T [T] F
Anderson-Gruneisen F [T] F
Seismic velocity options:
bounds VRH HS [VRH]
vrh/hs_weighting 0.5 0->1 [0.5]
explicit_bulk_modulus T [F] T
poisson_ratio on off [on ] all; Poisson ratio = 0.35
To change these options see: www.perplex.ethz.ch/perplex_options.html
Select operational mode:
1 - properties at specified conditions
2 - properties on a 2d grid
3 - properties along a 1d path
4 - as in 3, but input from file
0 - EXIT
2
Select properties [enter 0 to finish]:
1 - Specific Enthalpy (J/m3)
2 - Density (kg/m3)
3 - Specific heat capacity (J/K/m3)
4 - Expansivity (1/K, for volume)
5 - Compressibility (1/bar, for volume)
6 - Weight (%) of a component
7 - Mode (Vol, Mol, or Wt proportion) of a phase
8 - Composition (Mol or Wt) of a solution
9 - Gruneisen thermal ratio
10 - Adiabatic bulk modulus (bar)
11 - Adiabatic shear modulus (bar)
12 - Sound velocity (km/s)
13 - P-wave velocity (Vp, km/s)
14 - S-wave velocity (Vs, km/s)
15 - Vp/Vs
16 - Specific entropy (J/K/m3)
17 - Entropy (J/K/kg)
18 - Enthalpy (J/kg)
19 - Heat Capacity (J/K/kg)
20 - Specific mass of a phase (kg/m3-system)
21 - Poisson ratio
22 - Molar Volume (J/bar)
23 - Dependent potentials (J/mol, bar, K)
24 - Assemblage Index
25 - Modes of all phases
26 - Sound velocity T derivative (km/s/K)
27 - P-wave velocity T derivative (km/s/K)
28 - S-wave velocity T derivative (km/s/K)
29 - Adiabatic bulk modulus T derivative (bar/K)
30 - Shear modulus T derivative (bar/K)
31 - Sound velocity P derivative (km/s/bar)
32 - P-wave velocity P derivative (km/s/bar)
33 - S-wave velocity P derivative (km/s/bar)
34 - Adiabatic bulk modulus P derivative (unitless)
35 - Shear modulus P derivative (unitless)
37 - Absolute amount (Vol, Mol, or Wt) of a phase
38 - Multiple property output (PHEMGP format)
13
The prompts that follow a particular "property" choice are usually self-explanatory, additional information on property choice #8 is at solution_compositions_in_WERAMI.
Calculate individual phase properties (y/n)?Whether melts are classified as fluids in the context of the following prompt is determined by the melt_is_fluid option.
n
Include fluid in computation of aggregate (or modal) properties (y/n)?By default, WERAMI samples data on the nodes of the multi-level computational grid used by VERTEX. Only the lowest level grid is fully populated by data, thus sampling on higher level grids may involve interpolation. In some cases this interpolation may cause numerical noise in the output properties, should this occur the noise may be mitigated by specifying that VERTEX use a single-level high resolution grid.
n
Select another property or enter 0 to finish:
0
Change default variable range (y/n)?
n
Select the grid resolution (to use an arbitrary grid set sample_on_grid to F):
1 - 40 x 40 nodes
2 - 79 x 79 nodes
3 - 157 x 157 nodes
4 - 313 x 313 nodes [default]
4
**warning ver637** Immiscibility occurs in one or more phases interpolation will be turned off at all affected nodes.
Data ranges excluding values equal to bad_number (NaN) specified in perplex_option.dat:
vp, km/s
min 8.032687
max 8.939233
Output has been written to the 2d tab format file: in17a_1.tab
2d tab format files can be processed with:
PSTABLE - a Perple_X plotting program
PERPLE_X_PLOT - a MATLAB plotting script
PYWERAMI - petrol.natur.cuni.cz/~ondro/pywerami:home
spread-sheet programs, e.g., EXCEL
for details on tab format refer to:
perplex.ethz.ch/perplex/faq/perple_x_tab_file_format.txt
Select operational mode:
1 - properties at specified conditions
2 - properties on a 2d grid
3 - properties along a 1d path
4 - as in 3, but input from file
0 - EXIT
As indicated in the above output, the seismic wave-speed data has been written to a file named in17a_1.tab, the structure of this file is described at perple_x_tab_file_format.
Grid data generated by WERAMI can be plotted with external programs such as PYWERAMI or MatLab, alternatively (the relatively crude) Perple_X program PSTABLE can generate an encapsulated PostScript plot. PSTABLE and MatLab are demonstrated here.
c\jamie\perp666> pstable
Perple_X version
6.6.5.9, compiled 5/14/2011.
Reading computational options from: perplex_option.dat
Perple_X
plot options are currently set as:
Keyword:
Value: Permitted values [default]:
axis_label_scale
1.20 [1.2] (rel)
bounding_box :
0 [0] x-min (pts)
0 [0] y-min (pts)
800 [800] x-length (pts)
800 [800] y-length (pts)
field_fill
T [T] F
field_label
T [T] F
field_label_scale
0.75 [0.72] (rel)
font
Helvetica
grid
F [F] T
half_ticks
T [T] F
line_width
1.00 0-99 [1.] (pts)
picture_transformation :
0.180 [0.18] x-scale (rel)
0.180 [0.18] y-scale (rel)
130. [0.18] x-translation (pts)
220. [0.18] y-translation (pts)
0.00 [0.0] rotation (deg)
plot_aspect_ratio
1.000 [1.0] x_axis_length/y_axis_length
replicate_label
0.250 0->1 [0.025]
splines
T [T] F
tenth_ticks
F [F] T
text_scale
1.000 [1.] (rel)
To change these options edit or create the plot option file
See: www.perplex.ethz.ch/perplex_plot_options.html
Enter the
tab file name [without the .tab suffix]:
in17a_1
Unlike VERTEX, WERAMI and PSSECT, PSTABLE does not request the project name, but rather any Perple_X tab format file; the name of a tab format file consists of a root and the suffix .tab (file type indicator). WERAMI generates tab file names by taking the project root and appending a counter to distinguish different calculations.
Plot the ratio
of two dependent variables (Y/N)?
n
Select the dependent variable to be contoured:
1 - T(K)
2 - P(bar)
3 - vp,km/s
3
Although the WERAMI calculation illustrated previously requested only P-wave velocities as a function of the independent variables (pressure and temperature) specified in BUILD, the tab file in17a_1 includes the independent variables as pseudo-dependent variables hence the foregoing prompts. Whether WERAMI outputs the independent variables of a calculation as pseudo-dependent variables is determined by the spreadsheet keyword in perplex_option.dat.
Contour
the ratio of values in separate tab files (y/n)?
If you answer yes the data from the file just read will define the
numerator of the ratio and you will be prompted next for a file
containing the data for the denominator.
n
PostScript will be written to file: in17a_1.ps
The Encapsulated PostScript output file (in17a_1.ps) from PSTABLE is named by adding the suffix .ps to the root of input file.
Modify the default plot (y/n)?
y
To illustrate some of the options available in PSTABLE, the default plot is modified here.
Contour log10 of the dependent variable (y/n)?
n
Reset plot limits (y/n)?
n
Contoured variable range: 8.03269 -> 8.93923
Range excluding zero values: 8.03269 -> 8.93923
Modify default contour interval (y/n)?
y
Enter min, max and interval for contours:
8.05 8.95 0.05
Echo contour data to file contor.dat (Y/N)?n
Modify default axes numbering (y/n)?
y
Enter the starting value and interval for major tick marks on
the X-axis ( current values are: 673. 160. )
Enter the new values:673 100
Enter the starting value and interval for major tick marks on
the Y-axis ( current values are: 0.300E+05 0.100E+05)
Enter the new values:
3e4 1e4
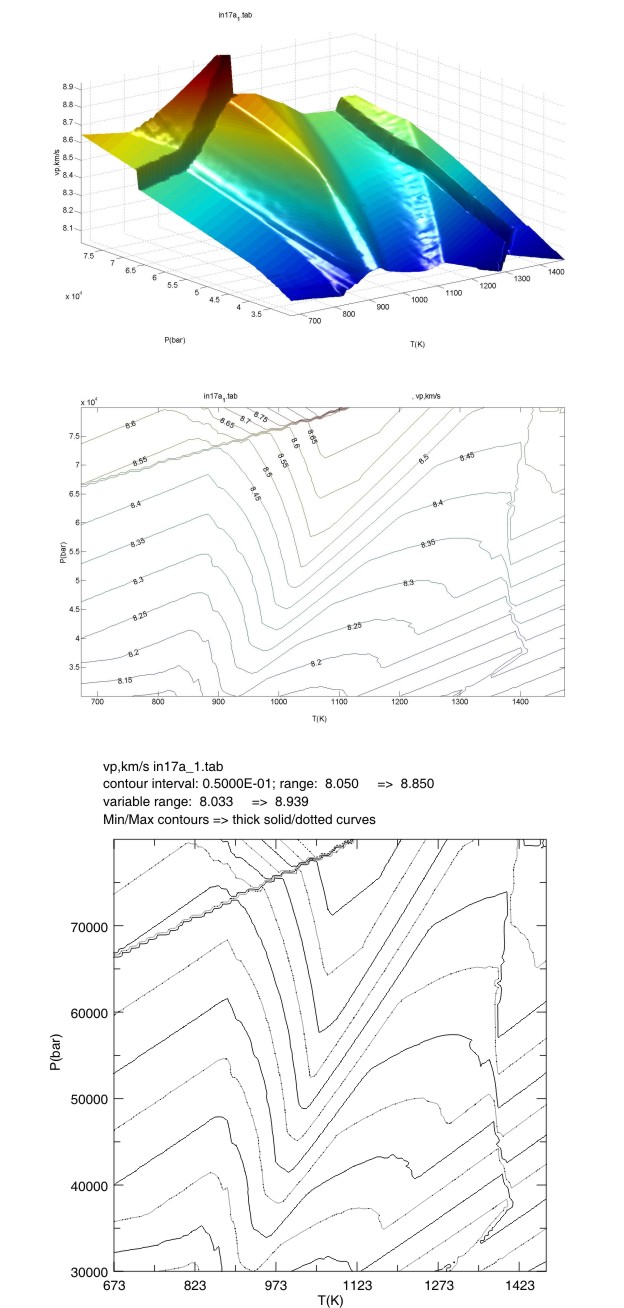
The output (Figure 3) from PSTABLE can be printed on any PostScript printer or viewed on a PostScript viewer such as Ghostview. Alternatively, the PostScript plot may be imported into graphical editors such as Adobe Illustrator or CorelDraw. PSCONTOR does not label the plotted contours, but it does use a heavy solid line for the minimum contour and a heavy broken line to indicate the maximum contour value. If this information is not sufficient to determine the contour values, WERAMI can be used in mode 1 to query the value of the property of interest at any point within the phase diagram section.
A MatLab script (perple_x_plot in Perple_X_6.6.7_MatLab_scripts.zip) is provided with Perple_X to allow users to view tab file data (see Perple_X tab file format for format details) quickly within Matlab. To make a MatLab plot, the user must start MatLab, change directory to the directory containing the perple_x_plot.m script, and type perple_x_plot (or perple_x_simple_plot), the rest is self-explanatory. The script provides several plot style options, two of which are shown in Figure 3.
Figure 3:
Three plot variations of the computed metabasalt P-wave velocities (km/s). The
uppermost plot is a 3D surface plot generated in MATLAB by
the script perple_x_plot. The middle plot is a manually labeled contour plot
generated in MATLAB by
the script perple_x_plot. The lowermost plot is the plot generated by PSTABLE.